Why not all – chocolate that is! 2 million Australians love bars, blocks & boxes

New research from Roy Morgan shows 14.2 million Australians aged 14+ consume chocolate in an average four weeks and chocolate bars are the preferred choice for more Australians than either chocolate blocks or boxed chocolates.
The research also identified Victoria as the chocolate ‘capital’.
Nearly 11 million Australians eat chocolate bars (77.5% of all Australian chocolate consumers) which include leading brands such as Kit Kat, Cadbury bars, Cherry Ripe, Mars Bars and Snickers.
Just over 8.9 million consume chocolate blocks (62.9%) such as Cadbury Dairy Milk, Fruit & Nut and Hazelnut, Lindt Dark or Kit Kat Blocks while 4.4 million indulge in boxed chocolates (31.1%) including Lindt Lindor Balls, Cadbury Favourites, Ferrero Rocher or Cadbury Roses.
Of course there’s a substantial amount of cross-over between the different types of chocolate and over 2 million Australians eat all three – bars, blocks & boxed chocolates – in an average four weeks equating to 15.1% of chocolate consumers.
The most popular combination for mixing and matching types of chocolate is those who consume both chocolate bars and blocks in an average four weeks numbering some 4.22 million, or 29.8%, of all chocolate consumers.
Types of chocolate eaten by Australian chocolate consumers – bars, blocks & boxed
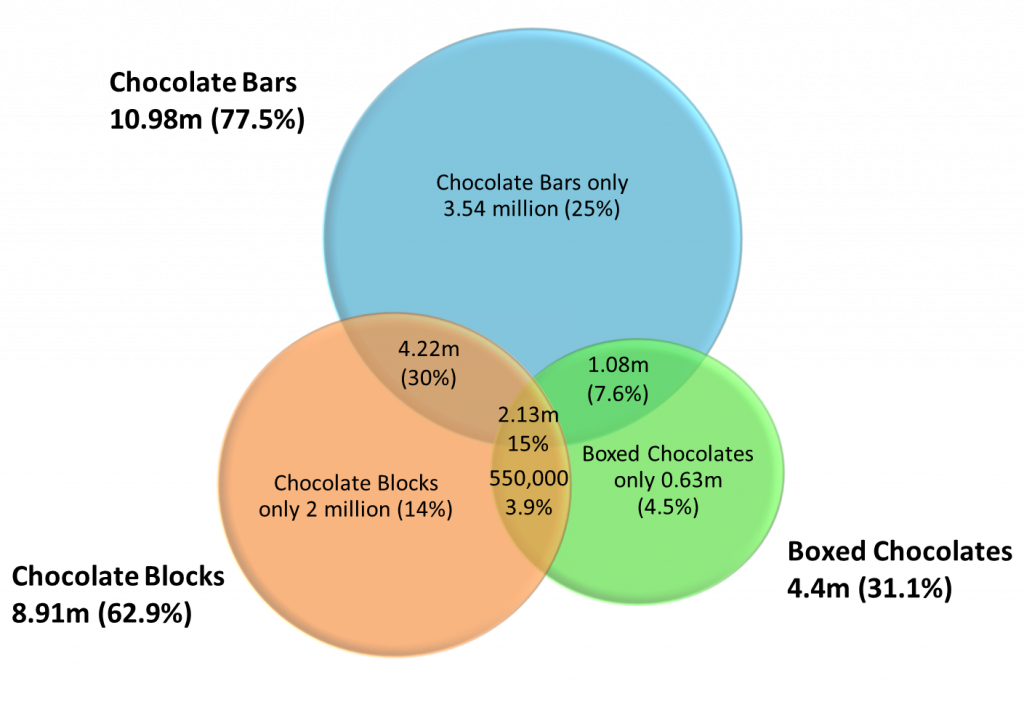
Source: Roy Morgan Single Source (Australia), April 2018 – March 2019 (n= 14,722). Base: Australian chocolate eaters 14+.
Women make up the bulk of chocolate consumers and Victoria is the chocolate ‘capital’
By delving into the qualitative and quantitative Roy Morgan data we are able to analyse what diverse characteristics define the people who are more likely to consume these three different types of chocolate and also what similarities there are between them.
The typical consumer of all three types of chocolate tends to be a well-educated woman who is either still at university or in gainful white collar employment with her own degree or diploma under her belt.
She lives in a household with an income of around $110,000 and has children of primary school, or early secondary school, age between 6-15 years old and is likelier than population numbers would suggest to come from Victoria. Victoria is the only State to rate above average for consumers of all three types of chocolate.
But despite these similarities significant differences between the typical consumer of these three types of chocolates do emerge on closer inspection.
Chocolate blocks find favour with Generation X (born 1961-1975)
Consumers of chocolate blocks tend to be older than for the other types of chocolate and more likely than the average Australian to be in Generation X and the Socially Aware Roy Morgan Value Segment – ‘community minded and socially active’. The quintessential chocolate block consumer is more likely than the average Australian to ‘buy additive free food’, ‘enjoy grocery shopping’, ‘like drinking wine with her meals’ and says she ‘likes to eat healthily but doesn’t want to compromise on taste’.
Chocolate bars are the pick of the Millennials (born 1976-1990)
The archetypal chocolate bar consumer is slightly younger and more likely than the average Australian to be in the Millennial generation and the Look At Me Roy Morgan Value Segment – ‘looking for fun and freedom away from the family’. The chocolate bar consumer is more likely than the average Australian to ‘buy more store’s own products than well-known brands,’ ‘often buy take away food to eat at home’ and ‘tend to snack throughout the day’ - and is more likely than the average Australian to say she would ‘like to be able to lose weight!’
Generation Z (born 1991-2005) has a particular taste for boxed chocolates
The prototypical boxed chocolate consumer is younger again and more likely than the average Australian to be in Generation Z born since 1991 and the Young Optimism Roy Morgan Value Segment – ‘young people conscious of the image they project and seeking to improve their prospects in life’. The boxed chocolate consumer is more likely than the average Australian to be ‘concerned about her sugar intake’, ‘love to do as many sports as possible’, ‘enjoy clothes shopping’, and describes herself as ‘born to shop’ and as someone who ‘enjoys food from all over the world’.
Chocolate ‘all-rounders’ are unlike other chocolate consumers
For the 2.13 million ‘all-rounders’ who eat all three including chocolate blocks, chocolate bars and boxed chocolates several characteristics stand out including that this group is almost evenly split between men and women, more likely to be under 25 than the average Australian and perhaps most surprisingly, far more likely to have an ‘underweight’ body mass index than the average Australian.
Before we get carried away with the notion that these underweight people are somehow a special breed who can eat as much chocolate as they like and stay slim – it is worth noting BMI increases with age, so these young people are probably simply enjoying their youthful body mass index.
Michele Levine, CEO of Roy Morgan, says:

“Australia’s 14.2 million chocolate buyers come in all shapes and sizes but some are ‘keener’ on a spot of chocolate than others and none more so than the 2.13 million who consume all three of chocolate bars, chocolate blocks and boxed chocolates in an average four weeks.
“Chocolate bars, which include well-known leading brands such as Kit Kat, Mars Bars, Cadbury bars, Cherry Ripe and Snickers, are the most popular type of chocolate consumed by just on 11 million Australians while nearly 9 million love biting into their favourite chocolate block.
“Boxed chocolates are often regarded as a good gift to mark special occasions such as birthdays, anniversaries and celebrations of other kinds and are consumed by 4.4 million with leading brands in the space including the premium selections of Lindt and Ferrero Rocher.
“It’s probably no surprise to many that women are Australia’s leading consumers of chocolate and comprise the majority of the markets for chocolate blocks, bars and boxed chocolates, however digging into the expansive Roy Morgan data allows insights not apparent to a casual perusal of the data.
“While chocolate boxes find their greatest appeal amongst the older Generation X, chocolate bars are the top pick of Millennials and the most likely generation to indulge in some boxed chocolates are in fact the younger Generation Z.
“Within these broader designations different brands appeal at varying levels to more defined demographic segments. Roy Morgan’s in-depth qualitative and quantitative data allows an understanding of exactly what drives the appeal of a particular brand by analysing the characteristics and attitudes of those who buy or consume that brand.
“Contact Roy Morgan to learn more about who buys chocolate bars, blocks and boxed chocolate and which of Australia’s leading chocolate brands such as Cadbury, Mars, Kit Kat, Lindt, Ferrero Rocher or many others are hitting the sweet spot of your desired demographic.”
Visit our Online Store to find out more about Australians who buy different types of chocolate including buyer and consumer profiles on Chocolate Bars, Chocolate Blocks or Boxed Chocolates.
For comments or more information please contact:
Roy Morgan - Enquiries
Office: +61 (03) 9224 5309
askroymorgan@roymorgan.com
Margin of Error
The margin of error to be allowed for in any estimate depends mainly on the number of interviews on which it is based. Margin of error gives indications of the likely range within which estimates would be 95% likely to fall, expressed as the number of percentage points above or below the actual estimate. Allowance for design effects (such as stratification and weighting) should be made as appropriate.
| Sample Size | Percentage Estimate |
| 40% – 60% | 25% or 75% | 10% or 90% | 5% or 95% | |
| 1,000 | ±3.0 | ±2.7 | ±1.9 | ±1.3 |
| 5,000 | ±1.4 | ±1.2 | ±0.8 | ±0.6 |
| 7,500 | ±1.1 | ±1.0 | ±0.7 | ±0.5 |
| 10,000 | ±1.0 | ±0.9 | ±0.6 | ±0.4 |
| 20,000 | ±0.7 | ±0.6 | ±0.4 | ±0.3 |
| 50,000 | ±0.4 | ±0.4 | ±0.3 | ±0.2 |